
While looking for an APM tool for the service, I decided to adopt Pinpoint.
What is APM?
Application Performance Management refers to the monitoring and management of the performance and availability of software applications.
What is Pinpoint?

Pinpoint is a distributed system tracing platform used to analyze the performance and structure of large-scale applications and to diagnose and handle issues. It is developed and maintained by Naver, a South Korea tech giant.
Advantages of Pinpoint
Open Source
As Pinpoint is open source, unlike paid APM solutions, it can be used freely within the scope of the open-source license. Additionally, since it is a tool developed by Naver, Korean documentation is also available.
Simple Installation
It is easy to install and apply, and the UI is intuitive.
Structure of Pinpoint
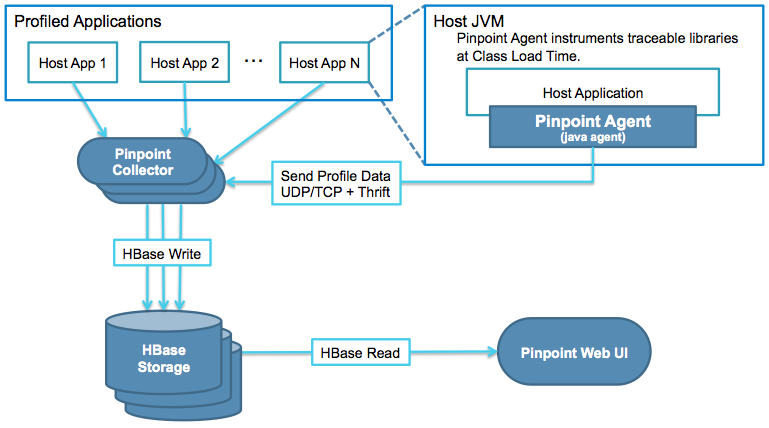
Pinpoint uses HBase as its metrics storage.
When the Agent collects data from the Application and sends it to the Collector, the Collector loads that data into HBase, and the Web UI reads the data from HBase to display it on the screen.
The flow follows: Agent(App) → Collector → HBase → Web.
For more detail, the Naver Developer Blog has a thorough writeup.
Implementing Pinpoint
Installation Environment
CentOS 7.6
Open JDK 1.8
Hbase 2.2.7
Pinpoint 2.3.0
1. HBase Installation
First, you need to install HBase, which serves as the storage.
You can download it from the Apache Mirror provided by Naver.
wget https://mirror.navercorp.com/apache/hbase/2.2.7/hbase-2.2.7-bin.tar.gz
Since HBase is Java-based, you must register the JDK path.
vi /conf/hbase-env.sh
Set it to the path where Java is installed.
export JAVA_HOME=java-path
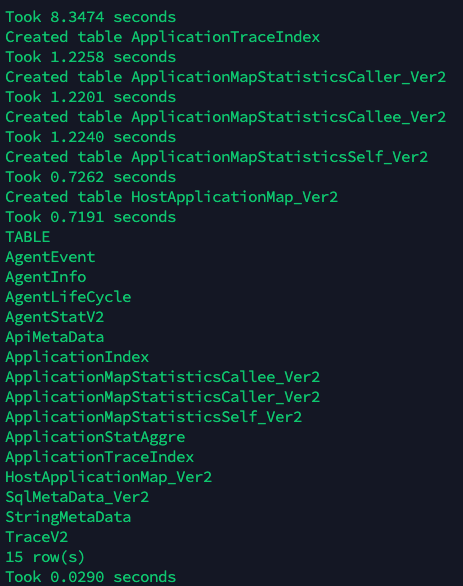
After starting HBase, run the Hbase Script used to create the tables for Pinpoint.
./bin/start-hbase.sh
./bin/hbase shell hbase-create.hbase
2. Pinpoint Installation
There are two ways to install Pinpoint: downloading the build results directly or setting everything up manually step by step.
In this post, I will apply it quickly by downloading the build results directly.
First, download the latest release of Pinpoint from GitHub. In this guide, only the Agent, Web, and Collector are used.
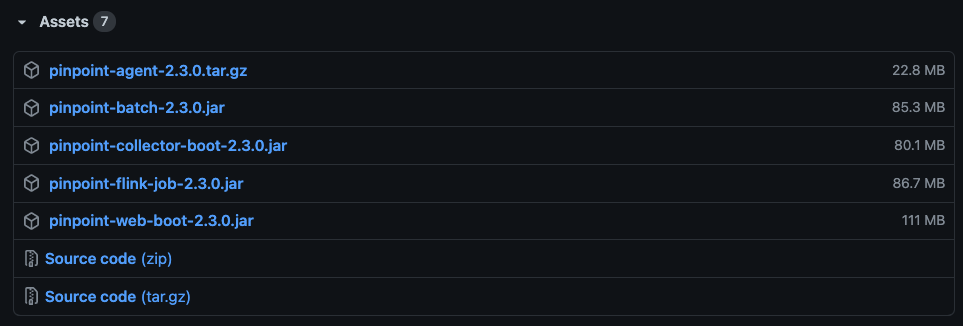
Then, run the Collector and Web application.
nohup java -jar -Dpinpoint.zookeeper.address=localhost pinpoint-collector-boot-2.3.0.jar
nohup java -jar -Dpinpoint.zookeeper.address=localhost pinpoint-web-boot-2.3.0.jar
If a blank Pinpoint page appears at localhost:8080 like below, it is a success.

3. Execution
When running the application to be monitored, specify Pinpoint using the -javaagent flag and add Pinpoint-specific parameters.
agentId is the unique ID for the agent attached to the application, applicationName is the name that will be displayed on the Web UI, and config specifies the path to the Pinpoint configuration file.
java -jar -javaagent:(PINPOINT Root)/pinpoint-bootstrap-2.3.0.jar -Dpinpoint.agentId=(Agent Id) -Dpinpoint.applicationName=(Application Name) -Dpinpoint.config=(pinpoint-root.config Root) (JAR NAME).jar
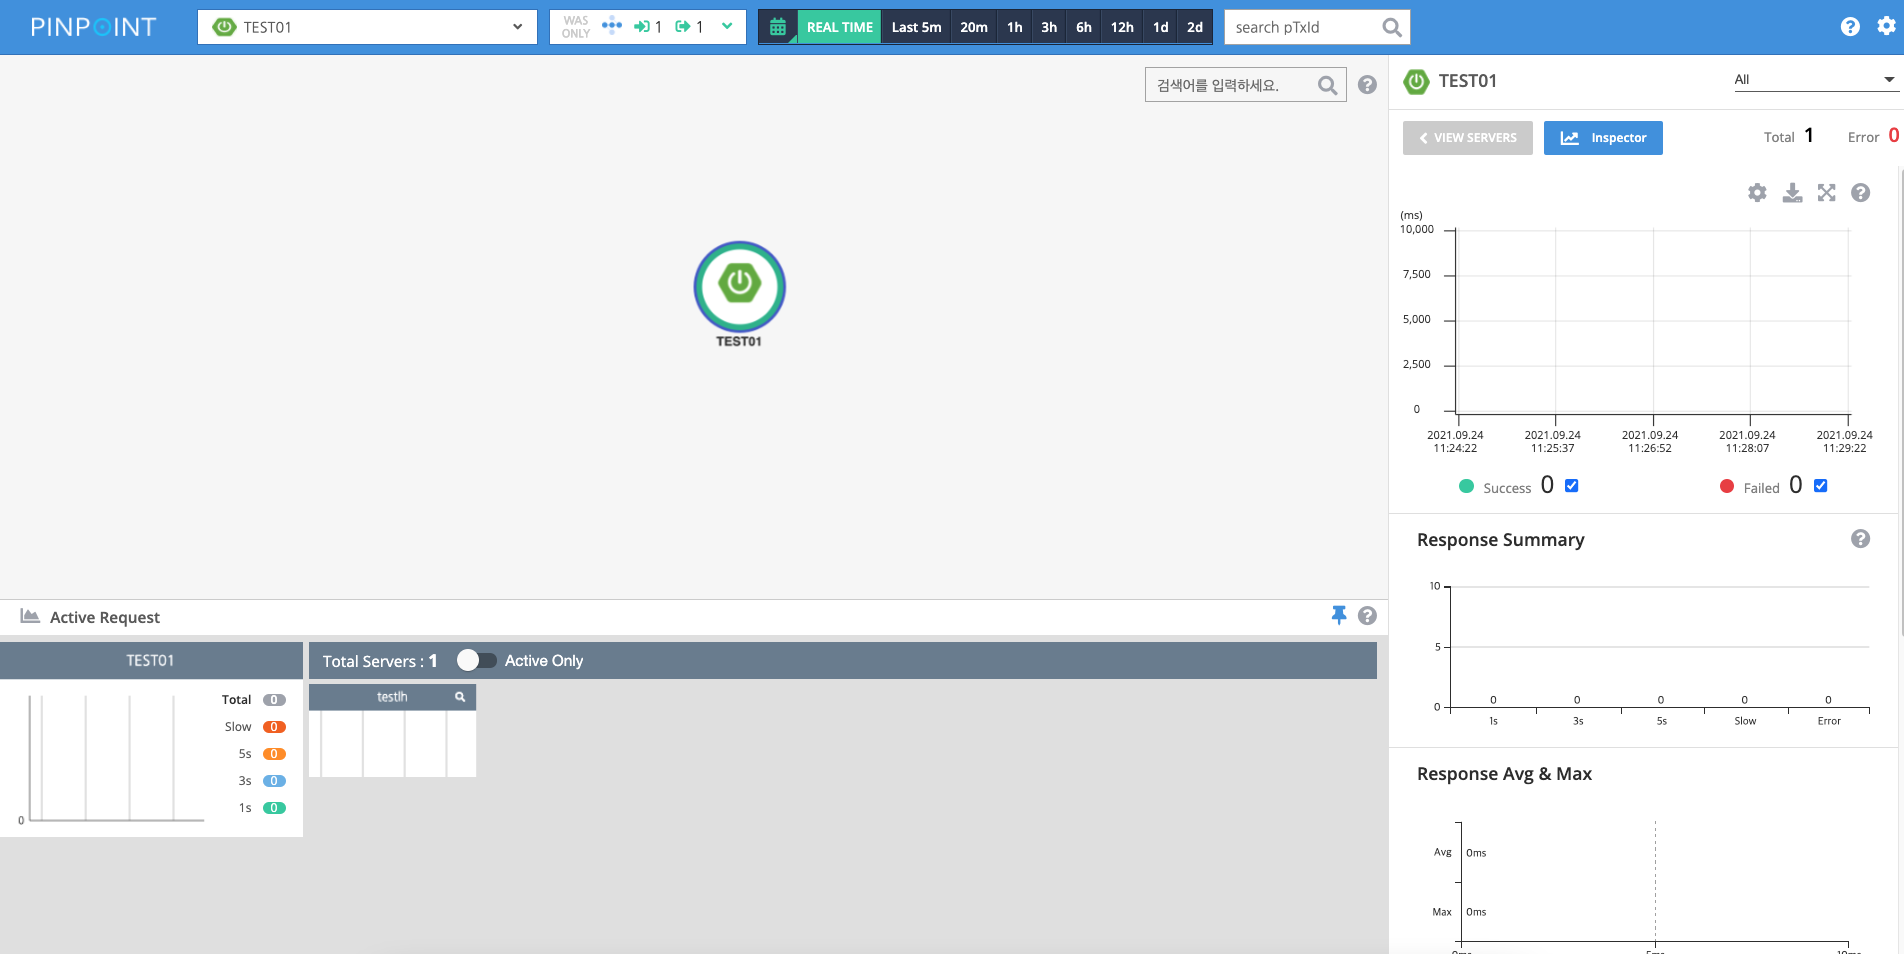
If the added application is visible on the web interface as shown below, the setup is successful.
4. Remote Server Configuration
When the Pinpoint server and the Agent server (the application being monitored) are hosted on different machines, you must specify the Pinpoint server’s IP address in the pinpoint-root.config file.
Simply replace localhost with the target IP address. If a firewall is active, ensure that ports 9991, 9992, 9993 are open for communication.
# gRPC Configuration
profiler.transport.grpc.collector.ip=localhost