Docker Swarm Monitoring Stack
All-in-one monitoring stack for unified application and hardware observability
TL;DR
- An all-in-one monitoring stack that runs on
Docker Swarm. - It uses the
ELK Stackto collect, transform, store, and visualize logs, and usesPrometheusandGrafanato collect and visualize hardware and container metrics. - It was designed to enable a self-hosted monitoring stack integrated with
Dockerenvironments where adoptingKubernetesis difficult. - Based on in-house system implementation experience, I built and open-sourced this stack.
Planning
Background
This project started from an observability system I developed to monitor two integrated services with different characteristics in-house.
The first service processes more than 200,000 transaction records in real time every month. Since these are critical data and any interruption in processing can cause major issues, I needed a system to verify data pipeline health and detect data anomalies for stable operations.
The second service is a high-load service with over 1 million lookup requests per day. For this reason, there was a need to monitor service stability, while also analyzing traffic to extract domain-level data and derive business insights.
To satisfy these needs, I needed an integrated observability system capable of monitoring both server and application status while collecting domain-level data.
However, as explained in the goals section below, there was no tool in the market that could satisfy all my requirements while still being easy to set up.
Based on my successful in-house implementation experience, I decided to build and publish this open-source stack myself.
Goals
1. Resolve Tool Fragmentation
There were many excellent open-source monitoring tools available, but tools that could integrate and manage them easily in a unified manner were rare.
In addition, self-hosting and connecting each tool to integrate them into existing infrastructure required significant infrastructure know-how and effort, making adoption difficult without specialized knowledge.
2. Support Container Environments and Orchestration
To make installation and management simple, I decided to build the system on a Docker container environment.
I also considered adopting container orchestration for system stability and horizontal scalability, but due to in-house infrastructure constraints, introducing Kubernetes was difficult.
Therefore, I needed an alternative that could orchestrate services while integrating easily with a standard Docker environment.
3. Handle Log Data Processing
The system had to integrate quickly with existing applications while processing diverse domain data, which required a system capable of analyzing application logs.
To analyze application logs accumulating at several GB per minute, it needed to handle large log traffic reliably, normalize logs into proper data formats, ingest and query data quickly and efficiently, and provide easy visualization.
Development
Tech Stack
1. Docker Swarm
Docker Swarm is the container orchestration layer that runs this entire monitoring stack.
As mentioned above, because Kubernetes was difficult to introduce in my in-house infrastructure environment, I needed an alternative that could provide orchestration while integrating easily with the existing Docker environment.
Docker Swarm, included in the Docker engine, had a relatively lower learning curve and could meet my target operational stability through built-in horizontal scaling and service placement control features, so I chose it.
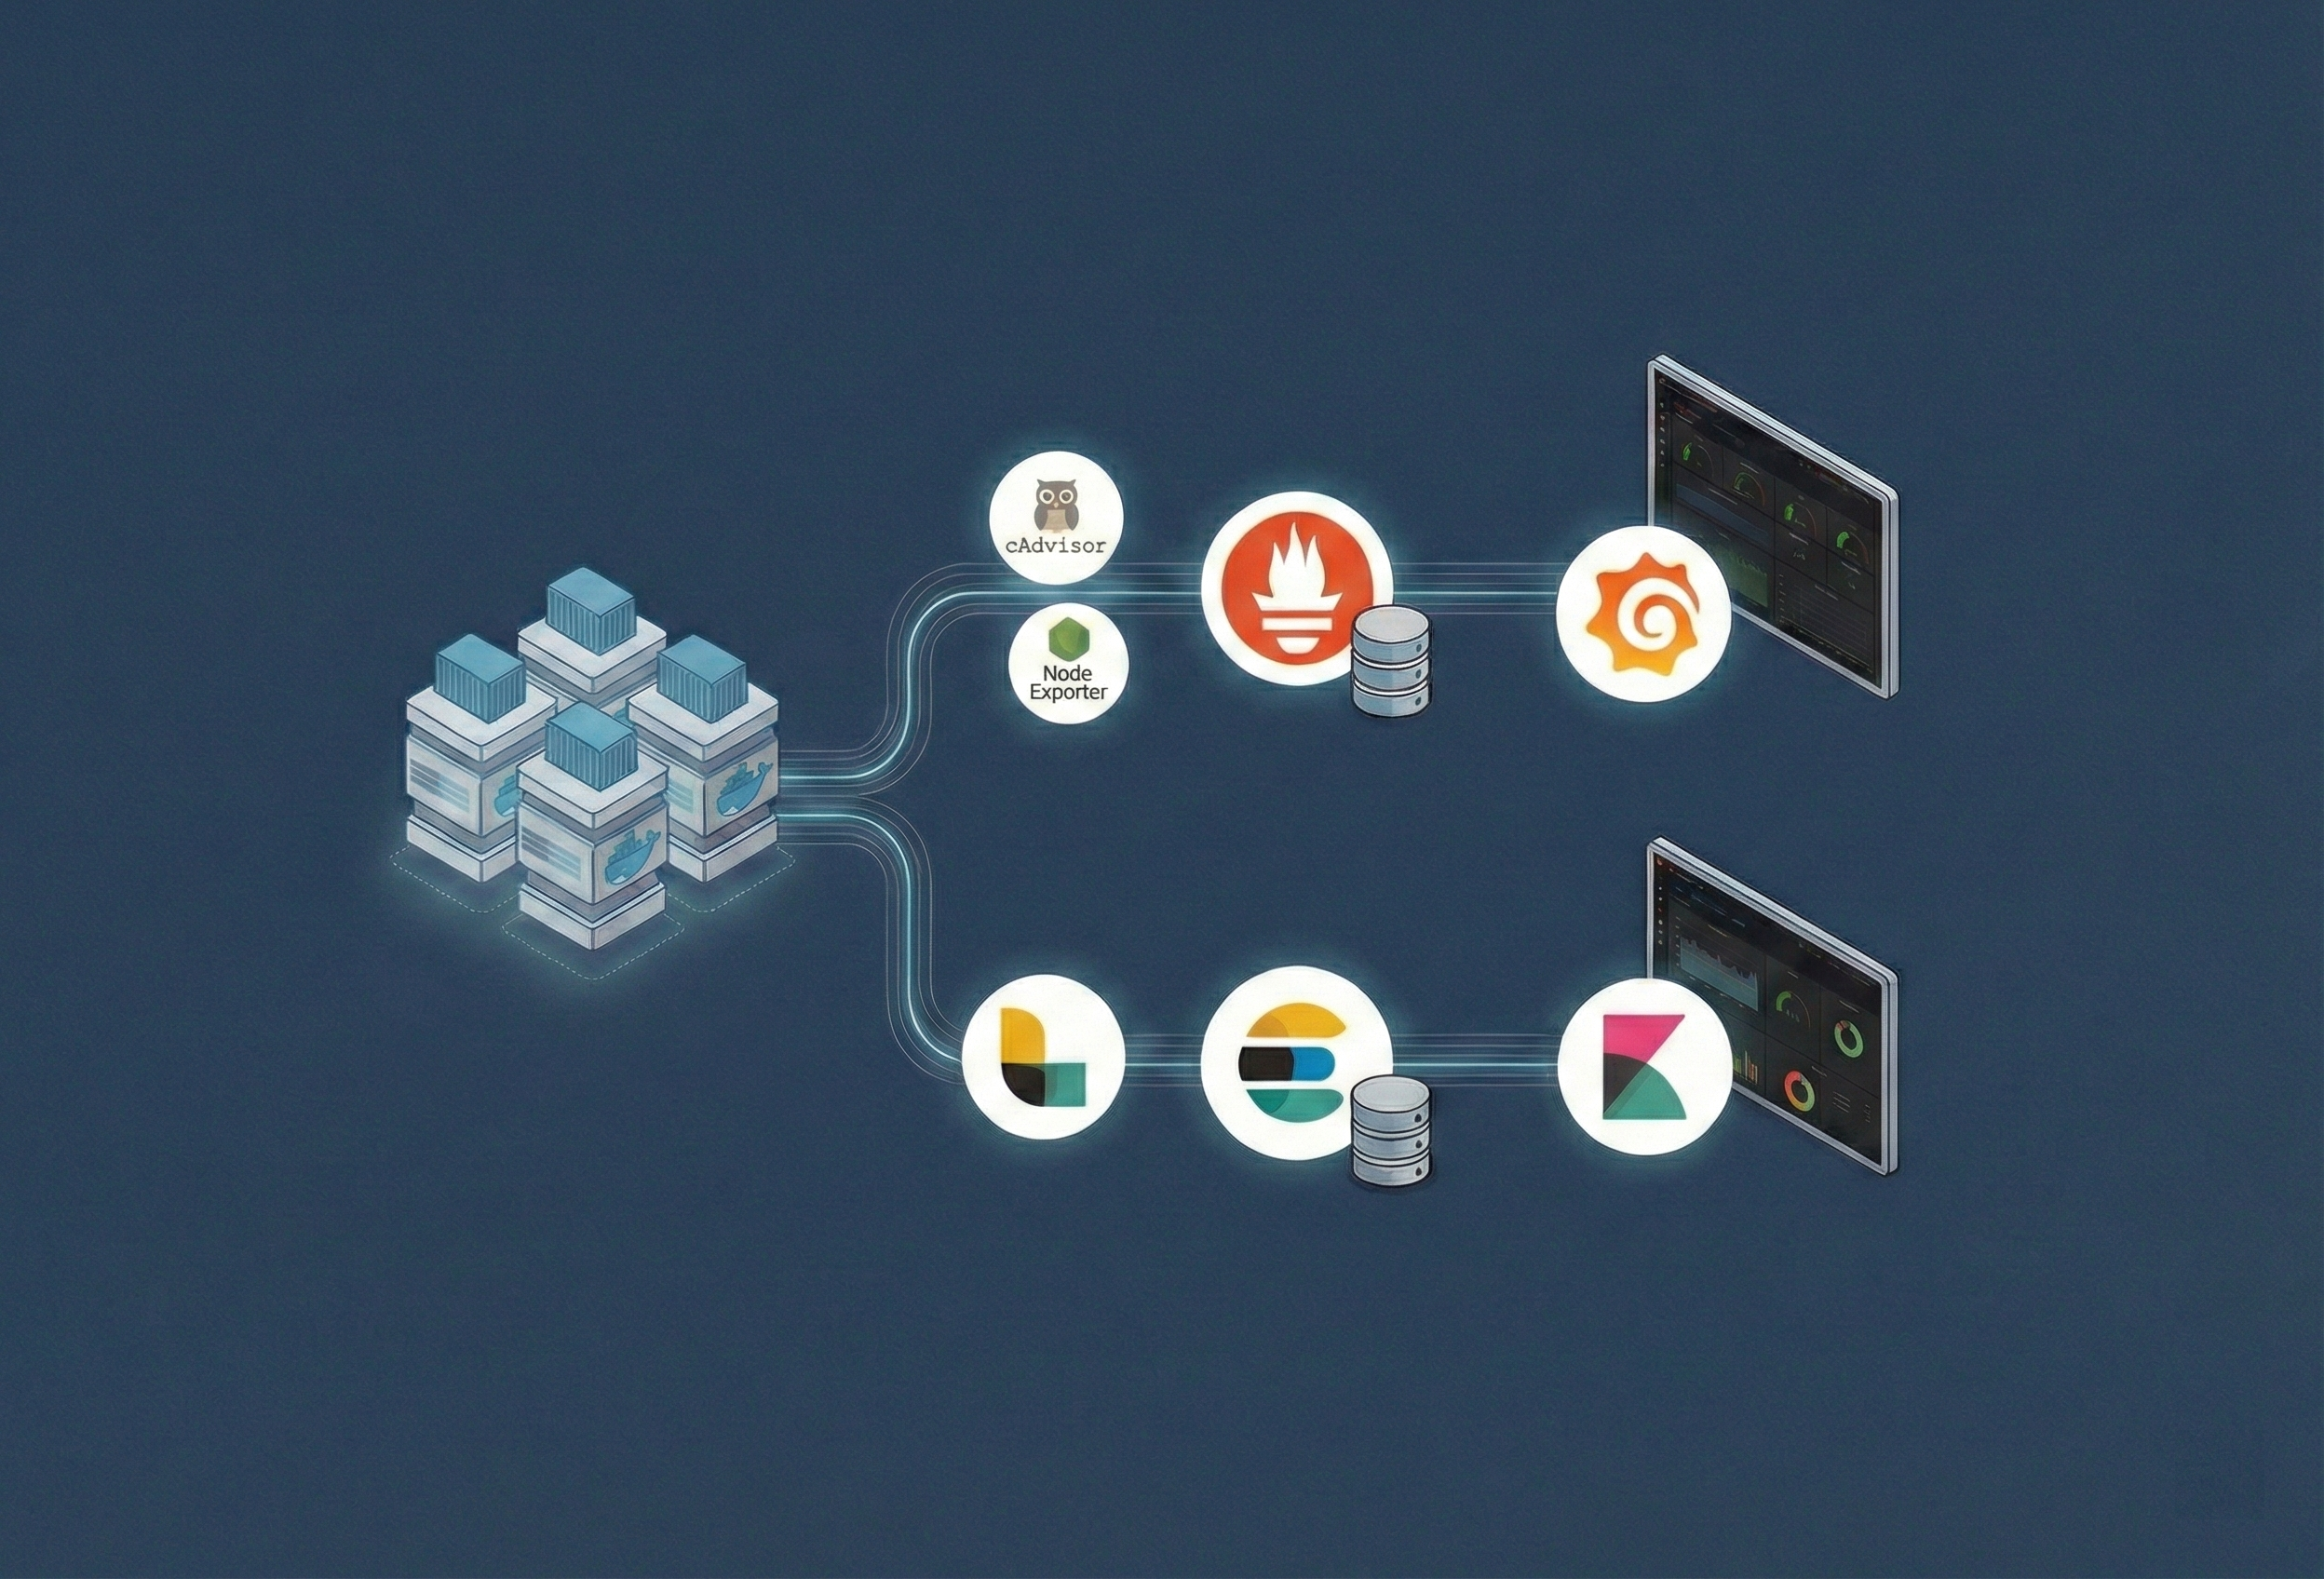
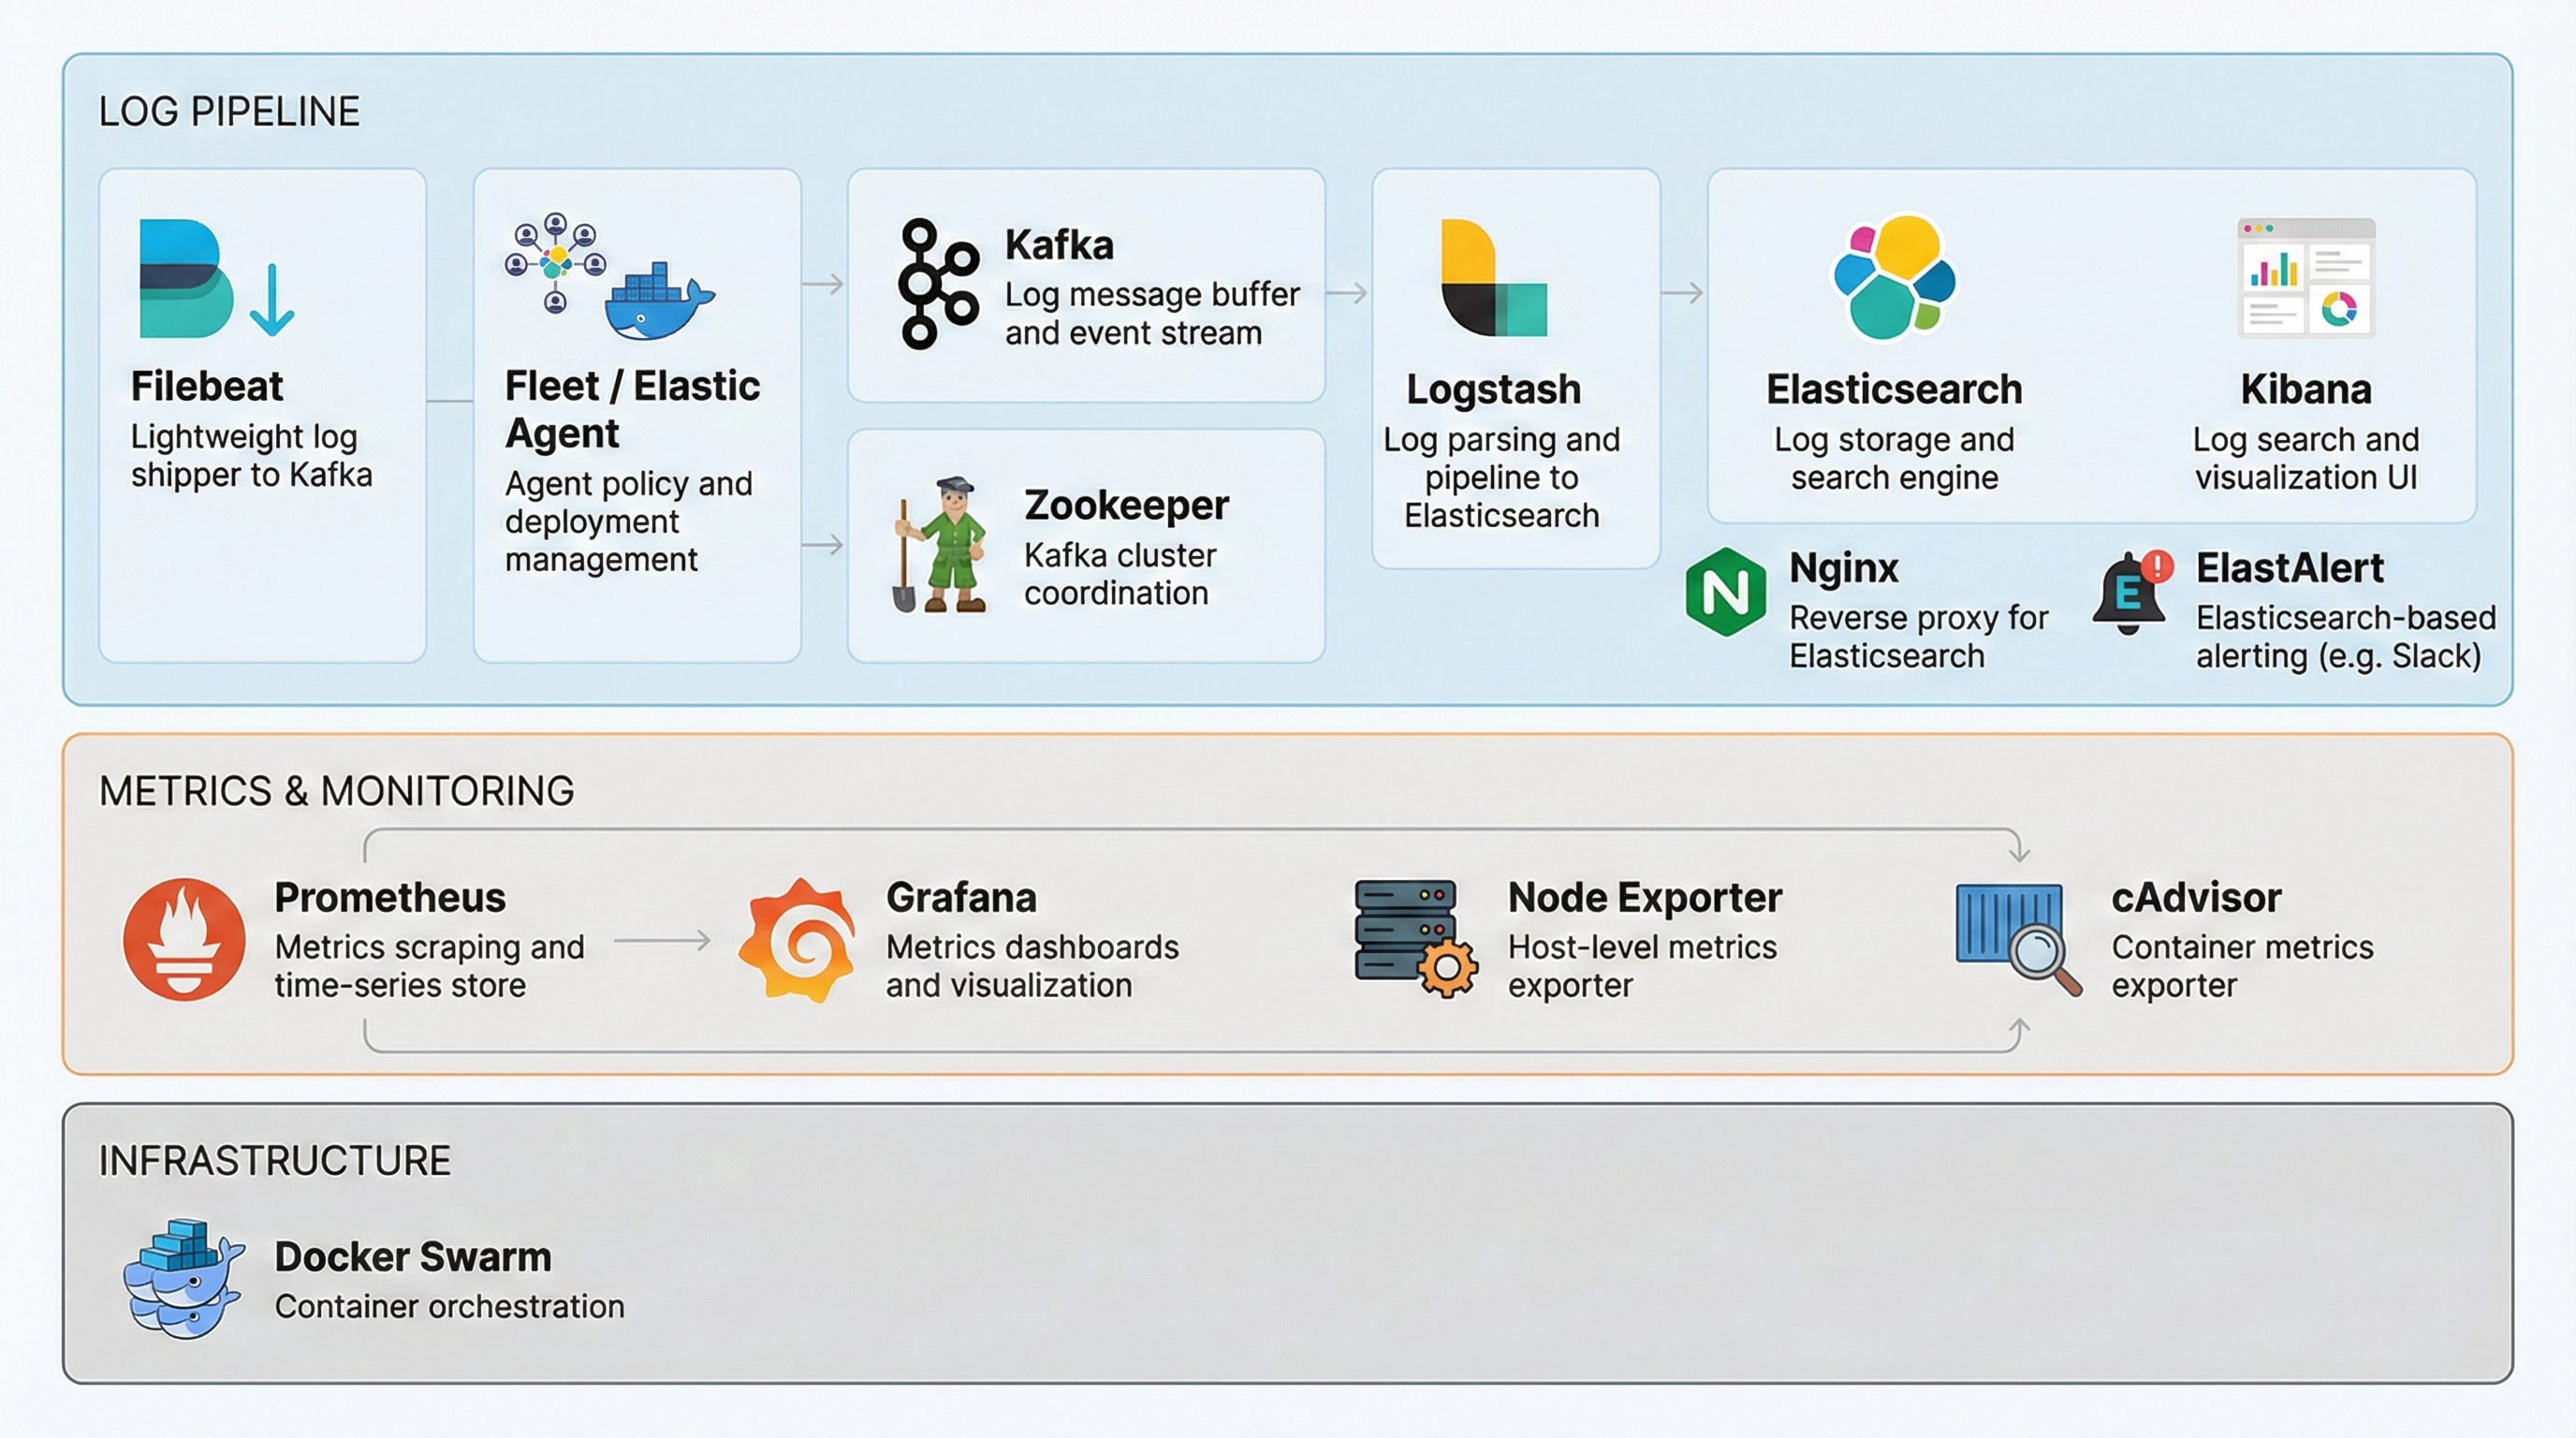
2. ELK Stack
The ELK Stack (Elasticsearch, Logstash, Kibana, Filebeat) handles the full pipeline of log data: collection, transformation, storage, querying, and visualization.
As noted earlier, I needed a proven combination that could satisfy easy setup, high-volume log traffic handling, log normalization and transformation, fast ingestion and querying, and simple visualization.
I chose the ELK Stack because it supports open-source self-hosting, flexible customization, and direct integration with other stacks.
2.1. Nginx
Nginx acts as a reverse proxy for Elasticsearch. In Swarm, Elasticsearch runs as clustered instances across nodes, so a single entry point accessible from outside Swarm is required
I also needed access control and security policies at that external entry point.
By configuring Nginx as a reverse proxy, both requirements are satisfied, which is why I selected Nginx.
2.2. Elastic Agent / Fleet
Elastic Agent is a unified agent that consolidates the Beats family, installed on target servers to collect metrics (APM, logs, hardware metrics) in an integrated manner.
It is connected to Fleet, the central policy server, enabling remote centralized management through Kibana without manually editing collection policies per server.
In the current ELK Stack ecosystem, the Elastic Agent + Fleet architecture is becoming the next-generation standard beyond the Beats family, and this project added support for that latest architecture accordingly.
2.3. ElastAlert
ElastAlert periodically queries Elasticsearch indexes to check whether data matches rules (frequency, patterns, and so on), and sends notifications to connected external channels when conditions are met. I used it to implement real-time, data-driven alerts.
Elasticsearch also provides built-in alerting features, but they were only available through paid subscriptions. I integrated ElastAlert as an open-source alternative for alerting.
3. Kafka & Zookeeper
Kafka serves as both a message buffer and an event pipeline between Filebeat and Logstash. It receives logs by topic and lets Logstash consume them, decoupling collection from ingestion so the pipeline does not break even under traffic spikes.
Zookeeper is a distributed coordination service that monitors the state of clustered Kafka brokers and supports failover in case of failures.
When I sent large amounts of log data directly to Logstash without buffering, server load became severe. I needed a data pipeline layer to buffer in between, so I introduced Kafka as the solution.
The detailed background and resolution process are explained in the troubleshooting section below.
4. Prometheus & Grafana
Prometheus collects and stores hardware and container system metrics through Node Exporter and cAdvisor installed on Docker Swarm node servers, and
Grafana queries the stored metrics and visualizes server and container resource status.
As mentioned above, I needed to monitor both application logs and server hardware metrics.
However, when handling time-series-based hardware metrics together in the ELK Stack, which is primarily specialized for domain-context analysis through document-based indexing, there was a resource inefficiency issue.
To solve this, I needed a lightweight stack optimized for metric aggregation, and ultimately adopted Prometheus and Grafana.
The detailed background and resolution process are explained in the troubleshooting section below.
4.1. Node Exporter & cAdvisor
Node Exporter collects system metrics per Swarm node (CPU, memory, network usage, and more) and sends them to Prometheus. I chose it as an official exporter in the Prometheus ecosystem for convenient integration.
cAdvisor collects system metrics per container running on each node and sends them to Prometheus.
Node Exporter collects whole-server metrics while cAdvisor collects service (container)-level metrics, enabling both server-level scaling decisions and container-level resource usage tracking.
Architecture
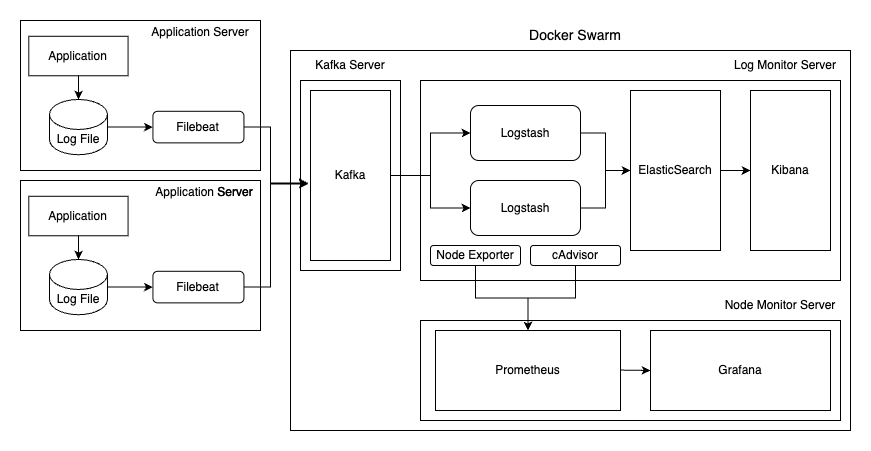
The architecture consists of an application server, a data buffer server, a log monitoring server, and a node monitoring server.
1. Application Server
This is the server where application instances being monitored run. Filebeat and Elastic Agent are installed on each server.
Filebeat reads log files generated by applications, adds metadata, and sends them to designated topics in Kafka.
At this point, Filebeat adjusts log-reading speed based on Kafka load conditions to prevent network overload.
Elastic Agent is the next-generation metrics collection agent that unifies the Beats series, collecting and sending data according to policies from the central policy server, Fleet.
In this project, a Fleet server is added to support migration to the Elastic Agent architecture, while Filebeat remains the default log collector.
2. Data Buffer Server
This server acts as a data buffer to control processing load between the application server and the log monitoring server, where Kafka and Zookeeper are deployed.
Kafka receives log data delivered by Filebeat, classifies and stores it as topic-based messages, and serves as a data buffer that delivers data when the consumer, Logstash, requests it.
Zookeeper manages Kafka cluster metadata and coordinates broker states.
In this project, clustering was not configured for simplicity, and to allow future expansion, the setup uses a single Kafka and Zookeeper bundled with Docker Compose.
3. Log Monitoring Server
This server handles log data collection, transformation, storage, querying, and visualization. It consists of the ELK Stack, Nginx, Fleet, and related components.
The ELK Stack is composed of Logstash, Elasticsearch, and Kibana.
Logstash fetches log data from Kafka, transforms it into the required format, and forwards it to Elasticsearch.
To process large volumes of data arriving through multiple topics, flexible scale-out is required, so it was configured to occupy multiple nodes.
Elasticsearch stores and indexes log data in document form and provides it as a data source. Like Logstash, clustering was enabled to support flexible scale-out.
In addition, placing Nginx as a reverse proxy provides a single entry point for external access while enforcing security.
Fleet is the central control server for Elastic Agent mentioned earlier, responsible for centralized collection policy management. It was added to support migration to the Elastic Agent-based architecture.
Kibana visualizes log data indexed in Elasticsearch and provides integrated ELK Stack management through its UI.
4. Node Monitoring Server
This server is responsible for collecting, storing, and visualizing hardware and container metrics.
Node Exporter, installed on each Swarm node, collects host (server) system metrics, while cAdvisor collects container resource usage metrics and sends both to Prometheus.
In this project’s architecture, where multiple container instances run together, I needed to monitor container-level resource usage in addition to server hardware, which led to this adoption.
Prometheus collects and stores node monitoring metrics in time-series format. It pulls metrics from endpoints of services including Node Exporter and cAdvisor, then compresses and stores them in a way optimized for time-series data processing.
Grafana visualizes time-series metric data stored in Prometheus as dashboards.
Troubleshooting
As mentioned earlier, building this project involved several constraints, including high-volume log data processing.
I will share what issues arose and how they were resolved during that process.
1. Log Data Processing Overload
As explained earlier, the log data to be processed was very large, ranging from hundreds of MB per minute to several GB.
In the initial setup, this high-volume data was sent directly from Filebeat to Logstash without a separate data buffer,
but because it could not continuously process data beyond Logstash capacity, performance gradually degraded and eventually processing stopped due to overload.
Since I planned to expand to more services later, I believed I needed controlled load regulation rather than simple server scale-out,
so I decided to introduce a layer in the middle of the log pipeline that would act as a data buffer.
When selecting a data buffer, I considered two perspectives.
The first was operational stability. Since it plays a critical role in controlling all log data flow in the middle,
it needed failover support for failures, immediate scale-out for additional demand, transmission aligned with consumer load, and easy integration with existing architecture.
The second was flow control capability. When handling data that requires different processing methods and domain-level classifications,
I considered a model where rules are defined per classification and data is produced and consumed individually according to those rules more scalable and intuitive than a single generalized filtering model for all use cases.
Therefore, I needed functionality to classify, produce, and consume data based on criteria.
After considering multiple options, I selected Kafka, which satisfied both perspectives.
Operational stability perspective
| Requirement | Resolution |
|---|---|
| Failover | Replication architecture enables continuous operation without data loss even during failures |
| Scale-out | Scale-out through broker and partition expansion as traffic grows |
| Consumer-load awareness | Pull model where consumers can consume as many messages as they can process |
| Existing architecture integration support | Official Kafka integration support in the ELK Stack |
Flow control capability perspective
| Requirement | Resolution |
|---|---|
| Data production classification | Topic-level producer data ingestion |
| Data consumption classification | Topic / custom-rule-based consumer message consumption |
By introducing Kafka, I could limit load on Logstash so it would not exceed available capacity,
and I could classify Logstash by domain rules and scale according to usage, allowing the architecture to support elastic scaling by throughput.
2. Heavy Hardware Metric Processing
As described above, this system needed to handle both log data and server (application) status data (that is, hardware metrics).
In the initial setup, hardware metrics were collected by Metricbeat, and the ELK Stack handled everything including hardware metrics, which caused two issues.
The first issue was in data storage. Resource contention occurred because logs and hardware metric data, which have different characteristics, shared the same Elasticsearch cluster.
Logs require event-level document processing (search, filtering, aggregation) because they need diverse storage and indexing strategies by domain and operational category,
whereas hardware metrics are simple time-series numeric data representing current conditions and typically have shorter data lifecycles; despite their large volume, they require little processing beyond time-series aggregation.
However, in the Elasticsearch environment, hardware metrics were also stored and indexed in document form like other data, which increased processing overhead and consumed log indexing throughput.
Also, as retention period grew, cluster load increased further, making long-term storage of hardware metrics difficult.
The second issue was in data visualization. Resource contention also occurred because data with different characteristics shared Kibana.
Since all data was visualized in Kibana, hardware metrics requiring continuous rendering of short-window time-series data
and log data requiring visualization of diverse forms across broader ranges for domain and operational needs
had to share the same resources, causing slower dashboard responses on one side when traffic on the other side increased.
These fundamental differences in data characteristics and mixed workload issues could not be solved by simply scaling computing resources. Therefore, I needed to separate hardware metric processing from the existing ELK Stack,
and I needed a lightweight database and visualization tool optimized for time-series data processing. As a result, I chose Prometheus and Grafana.
Data storage perspective - Prometheus
| Requirement | Resolution |
|---|---|
| Optimized time-series data storage | TSDB-based time-series optimized write path and compression algorithms, compressing storage to an average of about 1.3 bytes per sample |
| Remove indexing overhead | Label-based multidimensional data model minimizes I/O resources |
| Reduce long-term retention burden | Lower disk and storage costs by storing primarily simple Float64 / Timestamp numeric data rather than JSON document units |
Data visualization perspective - Grafana
| Requirement | Resolution |
|---|---|
| Optimize time-series query performance | Real-time rendering of large metric datasets with low overhead using PromQL specialized for numeric operations and aggregation |
| Dynamic dashboard composition | Flexible filtering and visualization even in dynamic environments where hosts and containers change frequently |
With the introduction of Prometheus and Grafana, I was able to physically separate log data and hardware metrics with different characteristics.
This reduced the load on the ELK Stack cluster and improved scalability while reducing storage and visualization costs by assigning each data type to a workflow suited to its characteristics.
Result
After successfully building the monitoring stack and introducing it to my in-house system, I built a generally reusable stack based on operational experience and released it as open source.
Since release, I have continued integrating open-source stacks that support self-hosting environments to support diverse monitoring use cases.
Closing
This was my first open-source development experience, and it was deeply meaningful.
In the process of identifying real problems, solving them, and publishing the results, I was able to think deeply about broadly applicable problem-solving approaches and developer experience optimization, and it also helped me better understand the context of open-source development.
Going forward, I will continue sharing solutions to problems I have experienced and consistently contribute to the developer ecosystem. Thank you.